
What Trends Are We Seeing?
The trend continues in the GTA with increasing average sale prices month over month for the fourth consecutive increase. The average sale price in April of 2023 was roughly four percent higher than that of March 2023. Stable interest rates, buyers coming off the sidelines where they were sitting in 2022, and limited supply has resulted in a competitive market for many buyers.
The supply side saw sales outpacing new listings resulting in an even more contracted supply side story than existed in the previous month. Sales were down by almost a third compared to April of 2022, and competition has once again become the norm as buyers flood the market.
Sellers continue to have hesitation to bring properties onto the market as they weigh the timing of their life changes to try and re-capture the highs which their neighbours who sold in 2021 and 2022 may have realized. With listings that are seeing over 100 showings in less than seven days, anywhere from five to 35 offers on offer nights and month over month average sale price increases sellers are once again engaging realtors to learn about the value of the assets in their real estate portfolio.
What Lies Ahead?
With 2023 forecasted to have the lowest number of sales since 2019 and buyers having re-entered the market, it is challenging to see a balanced market emerging. The increasing growth to the population at record levels, combined with unattainable new construction targets to create balance spell long term housing shortages for the foreseeable future.
The debt-to-income ratio of 180 percent is at a record high, which calls into question how long the GTA market can be sustained; however, what is propping up the market is the growth of population that comes with wealth. Domestically, balance would require incomes to swell by 40 percent and a 30 percent drop in prices.
The GTA real estate market has seen notable sustained growth for over 20 years, with buyers who enter the market sooner rather than later benefiting from the growth in equity that occurs over time and sellers being able to take advantage of sustained, excessive demand. While the timing for each participant in the real estate market should be assessed on a case-by-case basis, it is undeniable that if one enters the GTA real estate market, wealth can be created and this will continue to be the case for years to come.
What is Happening with Sale Prices
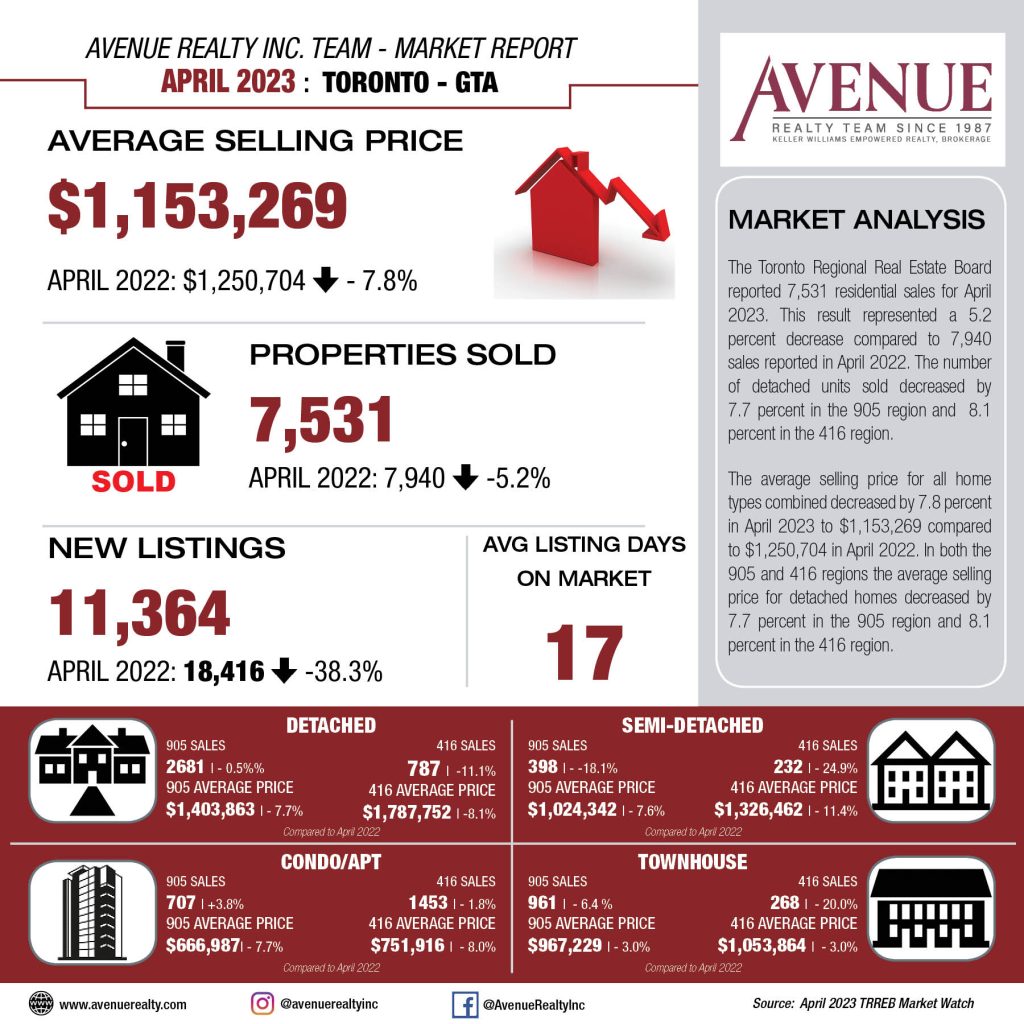
Average sale price for all property types for the month of April decreased by 7.8% year-over-year to $1,153,269 in April 2023 from $1,250,704 in April 2022. Month-over-month we saw a 3.1% increase from March 2023 to April 2023. On TRREB, for Toronto and the GTA, when broken down by product type and comparing April 2022 to April 2023 and March 2023 to April 2023, the average sale prices changes are as follows:
| Sale Price Comparison | ||||
| Product Type | Changes from April 2022 to April 2023 | Changes from March 2023 to April 2023 | ||
| Toronto | GTA | Toronto | GTA | |
| Detached | -8.1% | -7.7% | + 4.6% | + 0.26% |
| Semi-Detached | -11.4% | -7.6% | + 5.0% | + 3.65% |
| Townhouse | -3.0% | -3.0% | + 8.2% | + 4.43% |
| Condominium | -8.0% | -7.7% | + 2.6% | + 3.36% |
Number of Transactions Trend
When comparing April 2023 to April 2022, we saw the following trend:
| Categories | April 2023 | April 2022 | Percentage Change |
| Number of Transactions | 7,531 | 7,940 | -5.2% |
| Number of New Listings | 11,364 | 18,416 | -38.3% |
| Number of Active Listings | 10,373 | 13,092 | -20.8% |
- When comparing April 2023 to March 2023, we saw the following trend:
| Categories | April 2023 | March 2023 | Percentage Change |
| Number of Transactions | 7,531 | 6,896 | +9.2% |
| Number of New Listings | 11,364 | 11,184 | +1.6% |
| Number of Active Listings | 10,373 | 10,120 | +2.5% |
Looking into the different geographic pockets of Toronto and the GTA we notice the following changes in number of transactions when comparing April 2023 to April 2022 and March 2023. The breakdown per area and product type are as follows:
| Number of Transactions Comparison | ||||
| Product Type | Changes from April 2022 to April 2023 | Changes from March 2023 to April 2023 | ||
| Toronto | GTA | Toronto | GTA | |
| Detached | – 11.1% | – 0.5% | +15.2% | + 14.8% |
| Semi-Detached | – 24.9% | – 18.1% | +14.9% | + 12.4% |
| Townhouse | – 20.0% | – 6.4% | + 16.5% | + 2.6% |
| Condominium | – 1.8% | + 3.8% | + 3.05% | – 0.5% |
Footnote: Source of statistical data is from the April 2023 and March 2023 Market Watch report of the Toronto Region Real Estate Board (TRREB) MLS.
UPDATED ARI GRAPHIC
A – Monthly Percentage Change in the Number of Units Sold

B – Month Over Month Average Price Percentage Change

C – Seasonally Adjusted Month Over Month Average Price Percentage Change

D – Monthly Percentage Change in Average Sale Price