What Trends are we Seeing?
Below are some facts to consider:
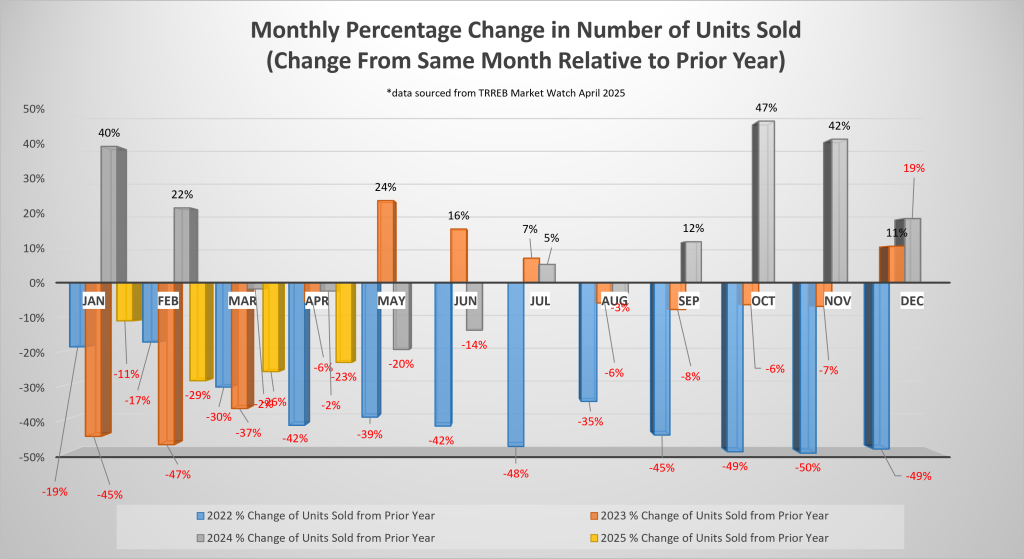
- Number of homes sold April 2024 were DOWN 23 per cent year-over-year
- Number of homes sold April 2024 were UP 1.8 per cent month-over-month
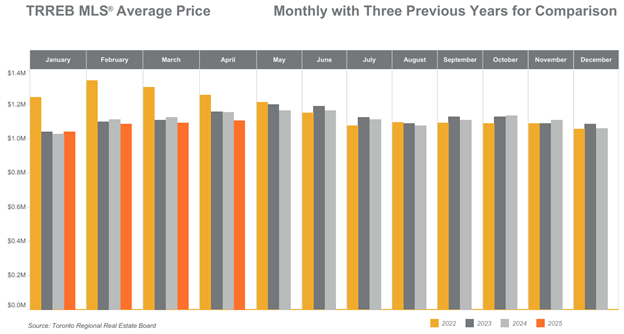
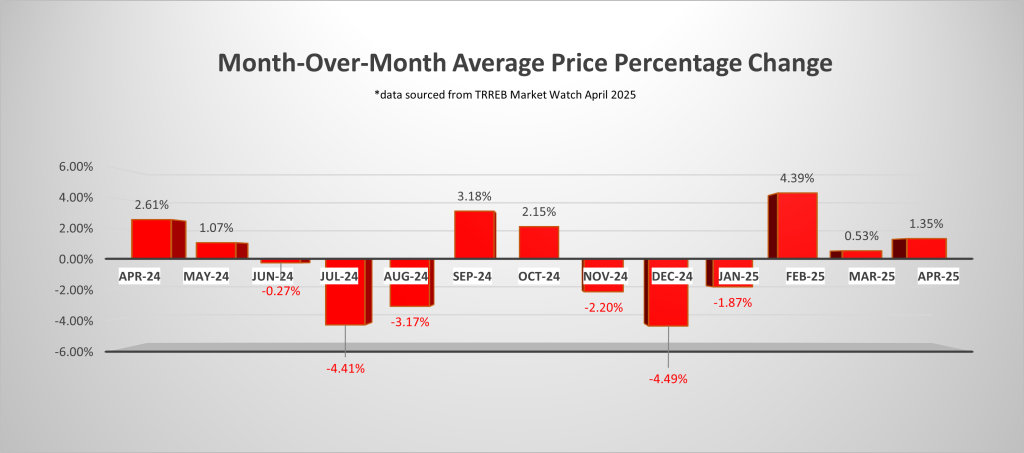
- Average price is essentially FLATLINED
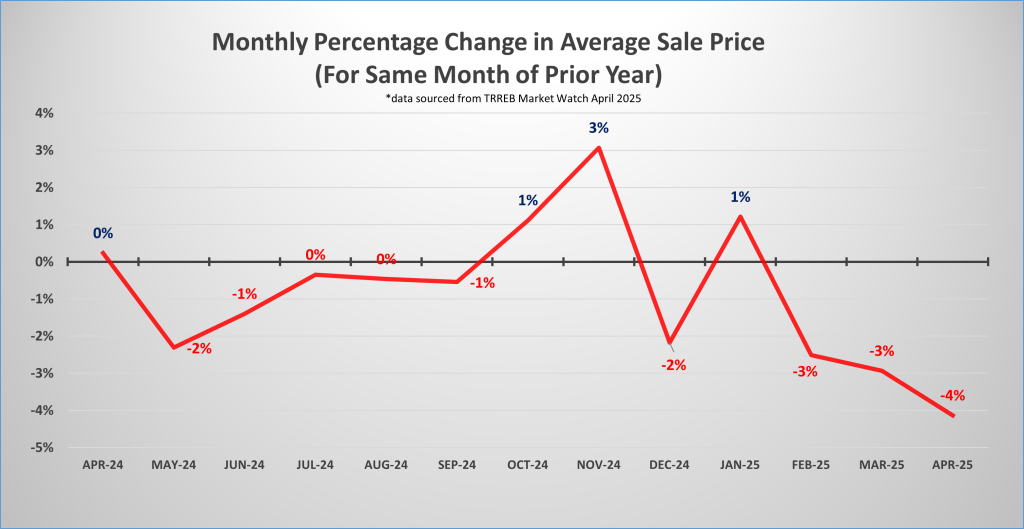
- April 2024 experienced a 4.1 per cent decrease in average price year-over year
- April 2024 experienced a 0.7 per cent decrease in average price month-over month
- Looking at average price on each month over the last three years we see that it is nearly flatlined (see illustration below)
- In Vaughan, we consistently see multiple offers on semi-detached and townhouses
- In Durham, there was a residence listed for $769,000, received 22 offers and sold for $920,000
- The “ultra-luxury” sector (properties over $10 million) showed significant year-over-year growth in the first quarter of 2025 with five properties sold on MLS in the Greater Toronto Area (GTA) up from zero relative to the first quarter of 2024
“Interesting” is a word that can be used to sum up what the real estate market is doing and not doing right now. Without insight one might think that it “doesn’t make sense” and there is no clear path forward. Let’s break things down at a macro level and provide some clarity!
What Lies Ahead?
With clarity provided for Canadians and a government in place and a certain numbness to the noise from the south we have noticed a reduction in overall anxiety around real estate decisions of late. Some of this is a result of a more defined interest rate pathway for the remainder of the year.
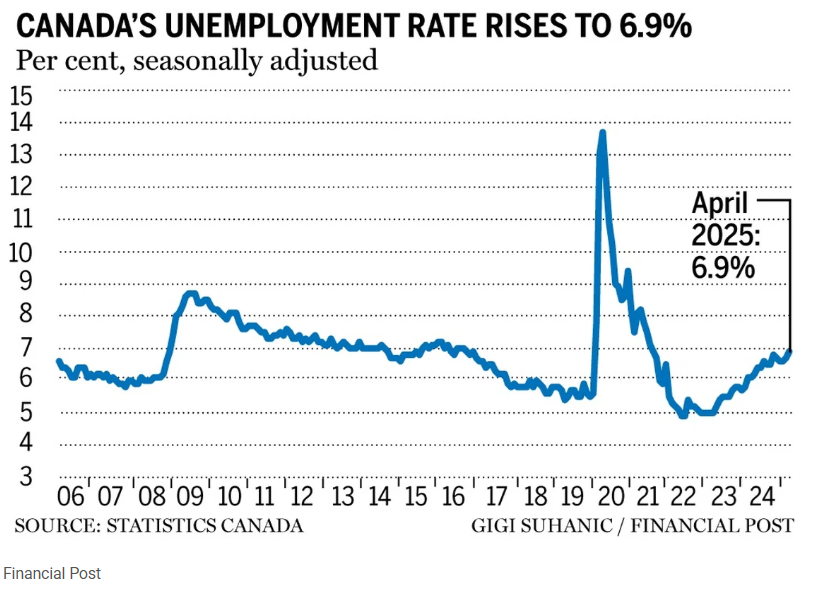
Friday’s (May 9th, 2025) unemployment figures showed an uptick to the unemployment rate to 6.9 per cent. There were 7,400 jobs added in April 2025; however, the participation rate grew by 0.1 percent to 65.3 per cent in April resulting in the increase in unemployment rate. Propping up the labour market was that there were 37,000 jobs added to public administration sector which would have largely been tied to temporary workers for the Federal election. BMO argues we would have seen a decrease in jobs in the magnitude of 30,000 if it wasn’t for public sector job gains.
Financial markets have priced in a 64 per cent probability that on June4th there will be an interest rate reduction by the Bank of Canada (BoC).
BoC deliberations illustrate that they project two economic scenarios and resulting Gross Domestic Product (GDP) outcomes. The tamed version has the trade war inflicting a moderate stall to the economy in Q2 2025 with some sharp declines in business investment but no recession. A more arduous version sees the entire economy entering into recession with a -1.2 percent GDP over four quarters. Deloitte projects Q2 2025 -1.1 per cent GDP and Q3 -0.9 per cent GDP as we slide into recession. Play with the data and various scenarios as you wish, however, GDP points towards rate cuts as well.
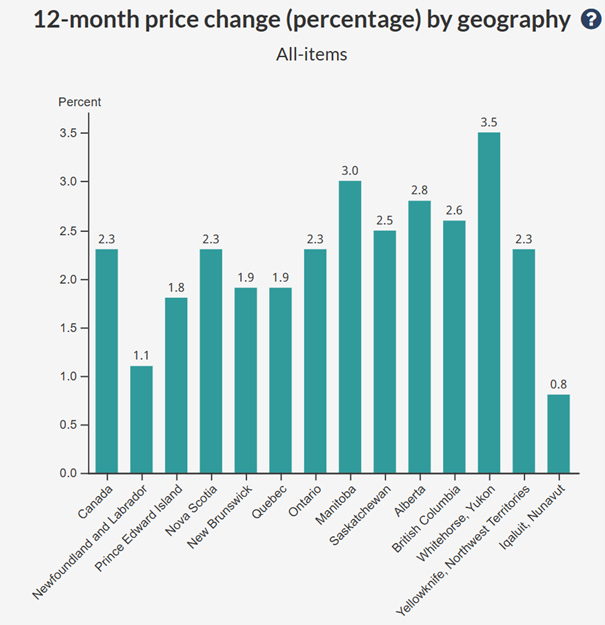
The inflation figures for March 2025 came in at 2.3 per cent. This was an increase of 0.3 per cent month-over-month. Overall, the consensus seems to be that while there may be an immediate bump in inflation, the downward pressure from an economic perspective will override the upward pressure of inflation allowing BoC to continue to reduce interest rates. Below we can see the March 2025 inflation figures Nationally and broken down by Province.
For buyers, have you ever tried to catch a falling knife? Be careful! While we see inventory climbing, it is important to investigate and determine what is happening in the market segment you are considering purchasing in. Currently with a Sales to New Listing Ration of 30 per cent the opportunity to negotiate with sellers and/or be in competition to purchase without exceeding prior market value sales exists.
For sellers, if you are thinking of selling in the next 12 months, now is the time to get prepared. Being ready to respond to your market segment and geographic locations’ activity and capture the A++ buyer is key. For different seller’s, based on your objectives, this could mean taking different actions from a preparation perspective, connect for details.
What is Happening with Sale Prices
| Sale Price Comparison | ||||
| Product Type | Changes from April 2024 to April 2025 | Changes from March 2025 to April 2025 | ||
| Toronto | GTA | Toronto | GTA | |
| Detached | -6.8% | -6.9% | -1.3% | -0.9% |
| Semi-Detached | -7.2% | -5.0% | -5.3% | +0.3% |
| Townhouse | +0.7% | -5.2% | +4.4% | -0.7% |
| Condominium | -7.3% | -6.1% | -0.8% | +0.5% |
Number of Transactions Trend
When comparing April 2025 to April 2024, we saw the following trend:
| Categories | April 2025 | April 2024 | Percentage Change |
| Number of Transactions | 5,601 | 7,302 | -23.3% |
| Number of New Listings | 18,836 | 17,418 | +8.1% |
| Number of Active Listings | 27,386 | 17,783 | +54.0% |
When comparing April 2025 to March 2025, we saw the following trend:
| Categories | April 2025 | March 2025 | Percentage Change |
| Number of Transactions | 5,601 | 5,011 | +11.8% |
| Number of New Listings | 18,836 | 17,263 | +9.1% |
| Number of Active Listings | 27,386 | 23,462 | +16.7% |
Looking into the different geographic pockets of Toronto and the GTA we notice the following changes in number of transactions when comparing April 2025 year-over-year to April 2024 and month-over-month to March 2025. The breakdown per area and product type are as follows:
| Number of Transactions Comparison | ||||
| Product Type | Changes from April 2024 to April 2025 | Changes from March 2025 to April 2025 | ||
| Toronto | GTA | Toronto | GTA | |
| Detached | -2.2% | -27.5% | +27.3% | +15.5% |
| Semi-Detached | +5.4% | -19.6% | +21.6% | +12.6% |
| Townhouse | -22.1% | -23.1% | +10.8% | +9.0% |
| Condominium | -29.9% | -31.5% | -0.2% | +5.9% |
Footnote: Source of statistical data is from the March 20205 and April 2025 Market Watch report of the Toronto Region Real Estate Board (TRREB) MLS.
A – Monthly Percentage Change in the Number of Units Sold
B – Month Over Month Average Price Percentage Change
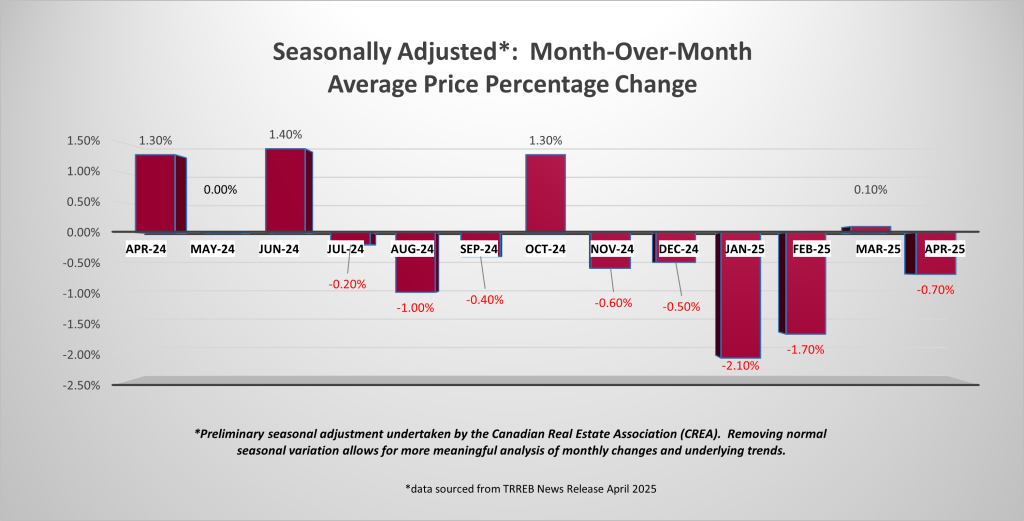
C – Seasonally Adjusted Month Over Month Average Price Percentage Change
D – Monthly Percentage Change in Average Sale Price