December 2025 - Market Stats
- Jan 12
- 4 min read

What Trends are we Seeing? December 2025 statistics saw an 8.9 per cent decline in number of sales on a year-over-year basis on the Toronto Regional Real Estate Board (TRREB). While to most real estate market observers, these are just numbers, they did capture some attention with sales being at a 25-year low. It is important to keep in mind that Q4 2025 was a period of momentum-building, during which those actively engaged in the market felt a noticeable increase in pace - momentum that was ultimately disrupted by the onset of the trade war. A year-over-year comparison of the Q4 months from 2024 to 2025 shows a quantitatively notable decline in sales, alongside weaker consumer sentiment in 2025. Overall, total sales in 2025 were 7.7 per cent lower than in 2024.
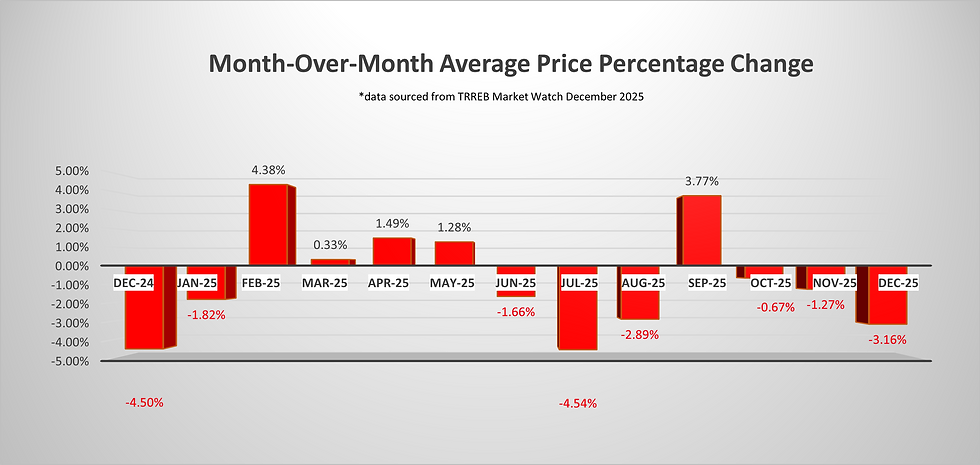
From a price perspective there was little change on a month-over-month basis with a decrease of one per cent from November to December 2025. Year-over-year saw a 6.3 per cent decrease in average prices on TRREB. Much of the conversation around the real estate market is that it has become more affordable over the last two years. While this is technically true with the reduction of interest rates and decreasing prices (27 per cent from peak), the average Toronto property price still stands at 2021 levels. This explains why despite the “affordability’ improvements buyers have still been holding off.
Total inventory, in December, found itself at record highs with 17,500 active listing, which was a 17.5 per cent increase on a year-over-year basis.

Housing confidence was a key constraint for buyers throughout 2025, driven by heightened uncertainty surrounding broader economic conditions and household job security. As a result, most market segments experienced overall declines, with only a small number of areas showing increases in both pricing and sales activity.

What Lies Ahead?
Stability amid uncertainty stems from the Bank of Canada’s constrained position. With ongoing uncertainty surrounding unemployment, GDP, inflation, and the Canadian–United States–Mexico Agreement (CUSMA), the Bank has adopted a wait-and-see approach. The Bank of Canada has indicated that the current 2.25 per cent policy rate, while at the lower end of the neutral range, still provides some stimulative support to the economy. Most economists are predicting either no interest rate change for 2026 or at earliest, noting it will be in Q4 of 2026. This is where the stability comes from. In theory, affordability aside, this should give confidence to buyers to move forward as there isn’t a reduction in rates coming and all expectations are that prices will stay flatlined this year without significant decrease or increase.
In a recent Financial Post survey, respondents were asked, “What are your biggest financial concerns heading into 2026?” Notably, despite three years of ongoing adjustment in the real estate market, only 4.7 per cent cited concern about a housing market crash. Instead, the primary concerns remain overall economic certainty and affordability.

With respect to economic certainty, unemployment figures were the first to be released in 2026. With the unemployment rate rising to 6.8 per cent there was little ammunition for the BoC to consider adjusting their position. The markets moved from a 70 per cent chance of an upward rate adjustment in Q4 2026 to a 60 per cent chance of a rate adjustment.

For sellers, when we have discussions around market value, many say they wish they had sold in 2021, yet, from an average price perspective, that is where we are today. The environment is different, however, the equity impact is the same. Discussions of achieving higher values are always on the forefront with our clients to determine how to maximize their real estate wealth. The key takeaway is that prior to 2008–2009, market cycles were typically measured in years rather than months.
For buyers, market indicators point toward the next BoC move being an increase in interest rates. Over the next five-to-10-year period, despite current inventory levels, we expect reversal of fortunes where demand will once exceed supply. Find your pathway forward, search for opportunities as holding your breath for something better may be a closing window over the next 12 to 18 months.
What is Happening with Sale Prices
Sale Price Comparison | ||||
Product Type | Changes from December 2024 to December 2025 | Changes from November 2025 to December 2025 | ||
Toronto | GTA | Toronto | GTA | |
Detached | +10.4% | -5.1% | -3.1% | -2.8% |
Semi-Detached | -10.9% | -4.3% | -5.5% | +0.4% |
Townhouse | -22.1% | -22.6% | +12.1% | +1.2% |
Condominium | -6.0% | -20.4% | -5.4% | -4.9% |
Number of Transactions Trend
When comparing December 2025 to December 2024, we saw the following trend:
Categories | December 2025 | December 2024 | Percentage Change |
Number of Transactions | 3,697 | 4,056 | -8.9% |
Number of New Listings | 5,299 | 5,205 | +1.8% |
Number of Active Listings | 17,005 | 14,476 | +17.5% |
When comparing December 2025 to November 2025, we saw the following trend:
Categories | December 2025 | November 2025 | Percentage Change |
Number of Transactions | 3,697 | 5,010 | -26.2% |
Number of New Listings | 5,299 | 11,134 | -52.4% |
Number of Active Listings | 17,005 | 24,549 | -30.7% |
Looking into the different geographic pockets of Toronto and the GTA we notice the following changes in number of transactions when comparing December 2025 year-over-year to December 2024 and month-over-month to November 2025. The breakdown per area and product type are as follows:
Number of Transactions Comparison | ||||
Product Type | Changes from December 2024 to December 2025 | Changes from November 2025 to December 2025 | ||
Toronto | GTA | Toronto | GTA | |
Detached | +10.4% | -5.1% | -31.2% | -24.7% |
Semi-Detached | -10.9% | -4.3% | -41.6% | -27.2% |
Townhouse | -22.1% | -22.6% | -39.2% | -26.1% |
Condominium | -6.0% | -20.4% | -21.1% | -20.0% |
Footnote: Source of statistical data is from the November 2025 and December 2025 Market Watch report of the Toronto Region Real Estate Board (TRREB) MLS.
A – Monthly Percentage Change in the Number of Units Sold

B – Month Over Month Average Price Percentage Change
C – Seasonally Adjusted Month Over Month Average Price Percentage Change

D – Monthly Percentage Change in Average Sale Price


Comments