May 2026 - Market Stats
- Jun 8
- 5 min read
Updated: Jun 9
What Trends are we Seeing?
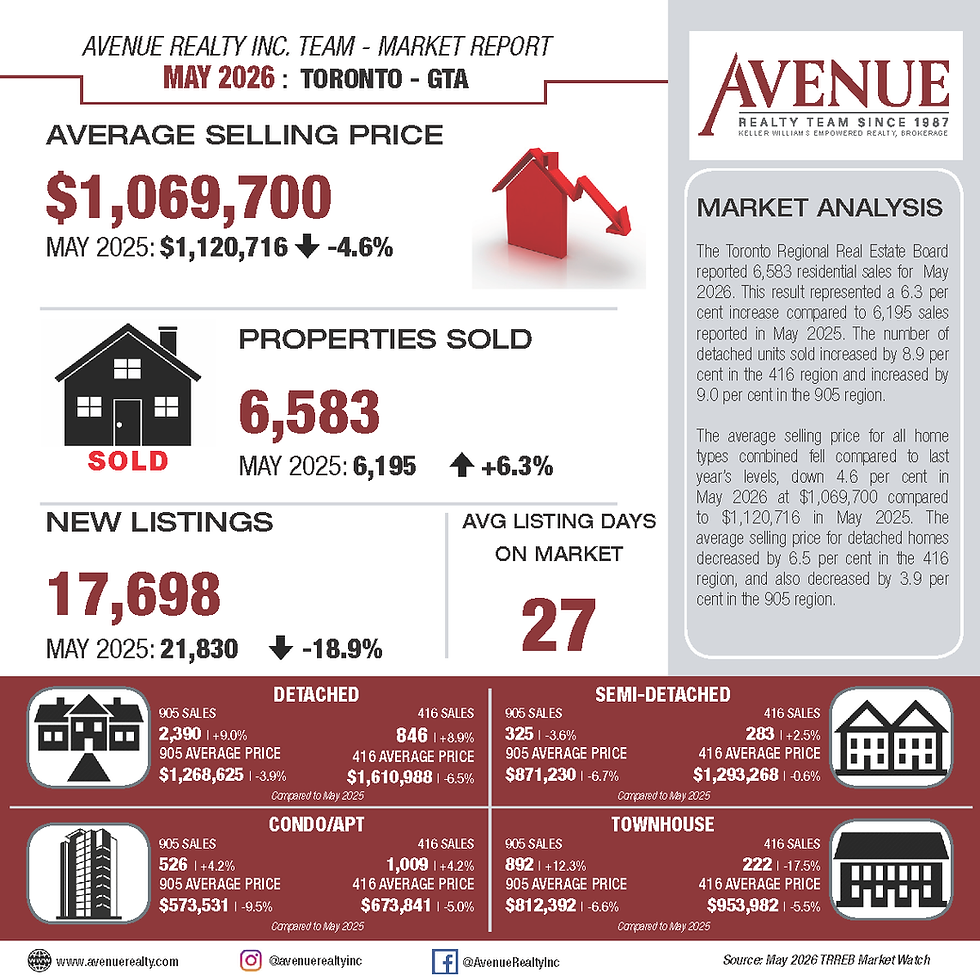
Headlines sound like we are seeing great progress with respect to a real estate recovery. We have four consecutive months of increased prices on a month-over-month (MoM) basis, increased number of sales on a year-over-year (YoY) basis, and less new inventory hit the market May 2026 than in May 2025. Here’s how the numbers played out:
The price of a typical home increased 0.25 per cent MoM
Existing home sales increased 6.3 per cent YoY
New listings were down YoY by 18.9 per cent
As we have said before, perspective matters, consider this:
Average prices in May 2026 ($1,069,700) are 4.8 per cent lower than May 2025 ($1,120,716)
Average prices in May 2026 ($1,069,700) are 24.7 per cent lower than peak 2022 ($1,334,062)
Home sales in May were the third weakest number of sales for the month in the last 25 years
The number of active listings is the second highest count since May 1996

This isn’t just a matter of saying it depends on how you look at things. The intricacies of the market are creating different situations and opportunities depending on where you stand and what you are looking to do.
Anecdotally as we show buyers, we are seeing detached homes that are i) relatively turnkey and ii) priced between $1.0M to $2.0M move quickly and in some instances, with multiple offers. This aligns with what has show up statistically with an increase on a YoY basis of 9.9 per cent in detached home sales for the month of May. Listings above $3.0M are starting to get showings. Opportunities where a residence needs to be brought to the next stage of their economic life are getting some attention, however, buyers are seeking (and in some cases getting) value for their purchase to facilitate the sellers objective of deleveraging from their asset.
There is a clear picture of what the real estate market is doing right now. However, the picture is different depending on which price point, geographic location and market segment you are looking at.
What Lies Ahead?
Someone said the “R” word. Much of the last couple of weeks has been focused on the Q1 2026 annualized Gross Domestic Product (GDP) reading which was negative 0.1 per cent. This accompanied with a revision to the Q4 2025 GDP reading into negative territory had the term “technical” recession being used as the common understanding of when a recession is in place is two quarters in a row of negative annualized rates.
The fire around recession discussions, the potential impact on rates had water doused on it as the unemployment reading came in at 6.6 per cent with an additional 88,000 jobs added to the Canadian economy in May. The “R” word didn’t instantly shift from “recession” to “recovery”, however, it gave the C.D. Howe Institute (who generally rings the bell when a recession is in town) the confidence to indicate that despite the common statistical understanding of when a recession is in place, the economy saw GDP increase in more than half of the sectors over Q1 2026 and that the slowdown was not broad -based economic strain to warrant a recession reading.
Some economists are posturing that if it wasn’t for the oil supply shock and its impact on inflation we would be having rate decrease discussions. With core inflation still within the Bank of Canada (BoC) desired range, a wobbly economy and the Canadian-United States-Mexico Agreement (CUSMA) likely to have discussions to go into 2027 a rate hold for 2026 is likely. Depending on who you chat with and their crystal ball looking into the oil supply shock and CUSMA negotiations you hear that rates will hold throughout 2027 or increase to 2.75 per cent by the end of 2027.
What this means for the rest of 2026 is that interest rates are not likely to change.
For Buyers, be informed. We have seen movement in the three- and five-year fixed rates to the point that it has impacted some affordability. Start window shopping now if you plan to purchase in the next six to 24 months. Prior projects are already forecasting a housing supply shortage as early as 2029 given the abrupt halt to development due to the excess supply that currently sits on the market. With prices down approximately 26 per cent from peak, stretch now not later.
For Sellers, four consecutive months of price increases now. This isn’t meant to mislead you, the days of sign up in the morning and sold by the night have not returned (for most). Days on the market is still more than 30 and the number of showings before a home sells hovers around 20 (not accounting for re-lists). Timeline is your guide; we firmly believe your asset will be worth more in the long run than it is today. The measure of how much more and how long is the topic of discussion we can discuss as we support you whether to work with some of the buyers that have come off the sidelines or wait patiently for a recovered market not a recovering market.
What is Happening with Sale Prices
Sale Price Comparison | ||||
Product Type | Changes from May 2025 to May 2026 | Changes from April 2026 to May 2026 | ||
Toronto | GTA | Toronto | GTA | |
Detached | -6.5% | -3.9% | -3.5% | +0.8% |
Semi-Detached | -0.6% | -6.7% | +0.6% | +2.5% |
Townhouse | -5.5% | -6.6% | -0.4% | +1.1% |
Condominium | -5.0% | -9.5% | +1.3% | +0.2% |
Number of Transactions Trend
When comparing May 2026 to May 2025, we saw the following trend:
Categories | May 2026 | May 2025 | Percentage Change |
Number of Transactions | 6,583 | 6,195 | +6.3% |
Number of New Listings | 17,698 | 21,830 | -18.9% |
Number of Active Listings | 26,927 | 31,047 | -13.3% |
When comparing May 2026 to April 2026, we saw the following trend:
Categories | May 2026 | April 2026 | Percentage Change |
Number of Transactions | 6,583 | 5,946 | +10.7% |
Number of New Listings | 17,698 | 17,097 | +3.5% |
Number of Active Listings | 26,927 | 26,927 | +7.2% |
Looking into the different geographic pockets of Toronto and the GTA we notice the following changes in number of transactions when comparing May 2026 year-over-year to May 2025 and month-over-month to April 2026. The breakdown per area and product type are as follows:
Number of Transactions Comparison | ||||
Product Type | Changes from May 2025 to May 2026 | Changes from April 2026 to May 2026 | ||
Toronto | GTA | Toronto | GTA | |
Detached | +8.9% | +9.0% | +9.9% | +20.2% |
Semi-Detached | +2.5% | -3.6% | +19.4% | -0.3% |
Townhouse | -17.5% | +12.3% | -3.5% | +18.1% |
Condominium | +4.2% | +4.2% | -4.3% | +5.4% |
Footnote: Source of statistical data is from the April 2026 and May 2026 Market Watch report of the Toronto Region Real Estate Board (TRREB) MLS.
A – Monthly Percentage Change in the Number of Units Sold

B – Month Over Month Average Price Percentage Change

C – Seasonally Adjusted Month Over Month Average Price Percentage Change

D – Monthly Percentage Change in Average Sale Price


Comments