June 2026 - Market Stats

What Trends are we Seeing?
We are increasingly seeing circumstances where buyers are competing to purchase their next home. The nature of the competition is distinctly different than 2020 and 2021 markets. However, here is what we are noticing:
● Price-point up to $2,500,000 experiencing multiple offers
○ Most notably between $1,000,000 and $1,500,000
● Single family detached homes
● Some multiple offers are a function of strategic pricing and an offer date being set
● Other multiple offer situations are produced even though a home may have been on the market for more than 30 days - even after a first offer comes in and is registered, we're then seeing a second (or third) buyer come forward with their own offer on that same home
● Number of offers generally +/- five
● Sale price aligns with market values and not creating any "I cannot believe someone paid that!" moments
For some sellers and buyers, it can feel like a real estate recovery is well underway. For others, it can feel like we're still out in the wilderness without any clear picture in sight. Some buyers are struggling with the fact that they must compete for their next home while other buyers see an abundance of opportunities for their great next steps. The difference is a function of which market you are working with. Lower priced freeholds are pulling buyers off the sidelines while the $3,000,000+ category continues to struggle to find buyers ready to take next steps.
Here's a look at some relevant stats:
For a fifth straight month we have seen the benchmark average price increase on a month-over-month (MoM) basis. For perspective, the most recent increase from the prior month was 0.1 per cent. On a year-over year (YoY) and MoM basis we have seen more transactions than the prior period. All of this while the number of new listings have been going down on a YoY basis, most recently by 12.9 per cent.
What we are seeing is a recovery defined by a crawl which will slowly occur over time. If you aren't paying attention, you may miss out on opportunities to either buy or sell because while the overall market will crawl its way back to normalcy, some segments will be moving at a sprinters pace.
What Lies Ahead?
The CUSMA deadline came and went, we're now in a potentially 10-year three-way arm-wrestling match to find terms that are mutually acceptable between Canada, Mexico and the United States. There is seemingly a pathway forward with respect to the oil shock. Each of these forces should mean stability over time and encourage an overall economic confidence that subsequently results in comfort to make larger purchases like housing. Over the upcoming months, keep a close eye on our standard economic indicators - GDP, inflation, unemployment, and interest rates - for guidance on where things are headed.
The most recent April Gross Domestic Product (GDP) figures showed growth of 0.5 per cent. This growth was registered in 14 of 20 industries and we saw the service sector grow for a third straight month. This is a good sign that recession talk can be put to rest for now - though it's still worth monitoring closely in the months ahead.
Inflation seems to be getting a free pass. While many economists expect the headline inflation rate to be above three per cent, few believe it will be enough for the Bank of Canada (BoC) to consider any sort of rate tightening given the GDP and unemployment figures.
The unemployment rate is expected later this week with little to no change from May's reading of 6.6 per cent. A boring, stay-the-course reading is the favourite outcome for the BoC right now, because it adds fuel to the fire of the "do nothing" camp.
Many economists expect that the BoC will hold the current interest rate (2.25 per cent) throughout 2026 and well into 2027; despite the fact that the Federal Reserve may increase its rate in Fall 2026 and further weaken the Canadian dollar.
For Buyers, interest rates aren't changing anytime soon. Micro movements towards recovery are seen in the market. Unexpected buyer presence exists in some markets. Ensure you understand what is happening in the real estate segment that means the most to you.
For Sellers, interest rates aren't changing anytime soon. If rates do change, even a downward rate adjustment by the BoC isn't going to ignite the market for a quick recovery. Learn about what is happening in your market segment, understand the big picture of your real estate portfolio and make decisions that fit your objectives.
What is Happening with Sale Prices
Sale Price Comparison | ||||
Product Type | Changes from June 2025 to June 2026 | Changes from May 2026 to June 2026 | ||
Toronto | GTA | Toronto | GTA | |
Detached | +0.3% | -2.2% | +2.3% | +0.3% |
Semi-Detached | -1.1% | -6.7% | -2.2% | -0.9% |
Townhouse | +1.5% | -4.4% | +2.0% | -0.5% |
Condominium | -9.0% | -10.6% | -1.2% | -1.7% |
Number of Transactions Trend
When comparing June 2026 to June 2025, we saw the following trend:
Categories | June 2026 | June 2025 | Percentage Change |
Number of Transactions | 6,770 | 6,191 | +9.4% |
Number of New Listings | 17,282 | 19,847 | -12.9% |
Number of Active Listings | 27,329 | 31,565 | -13.5% |
When comparing June 2026 to May 2026, we saw the following trend:
Categories | June 2026 | May 2026 | Percentage Change |
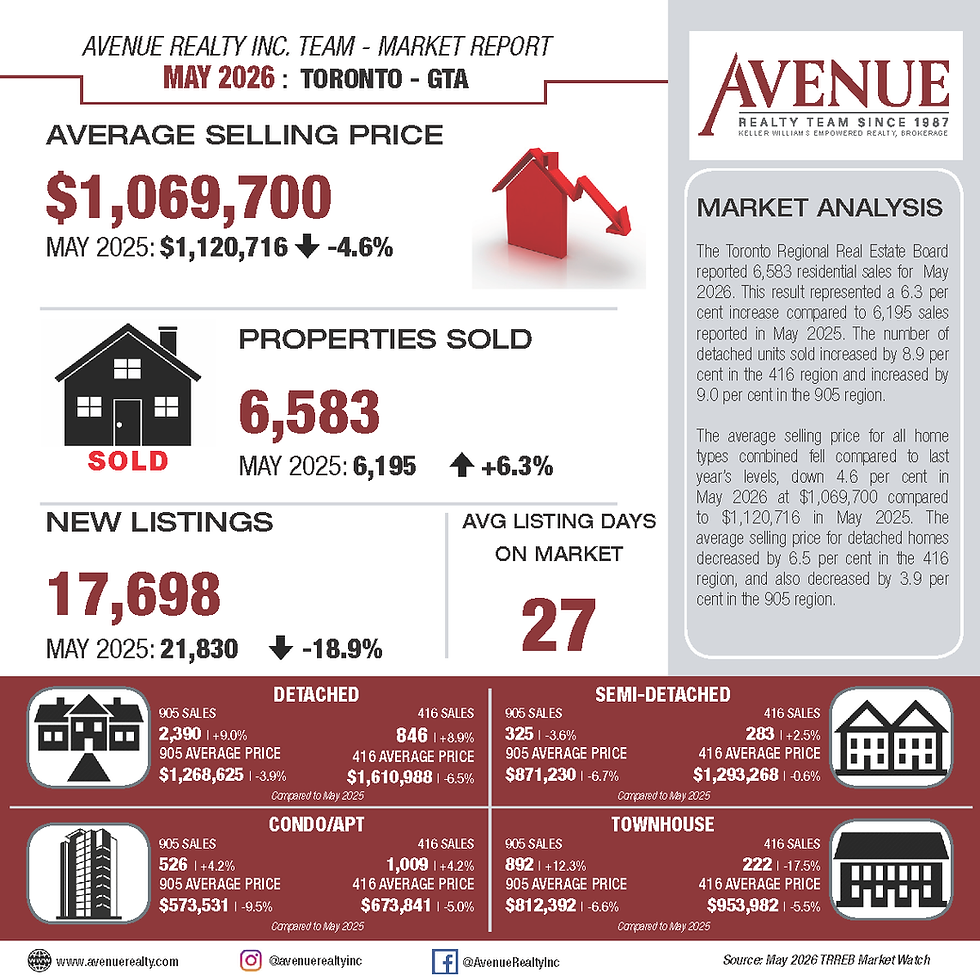
Number of Transactions | 6,770 | 6,583 | +2.8% |
Number of New Listings | 17,282 | 17,698 | -2.4% |
Number of Active Listings | 27,329 | 26,927 | +1.5% |
Looking into the different geographic pockets of Toronto and the GTA we notice the following changes in number of transactions when comparing June 2026 year-over-year to June 2025 and month-over-month to May 2026. The breakdown per area and product type are as follows:
Number of Transactions Comparison | ||||
Product Type | Changes from June 2025 to June 2026 | Changes from May 2026 to June 2026 | ||
Toronto | GTA | Toronto | GTA | |
Detached | +0.4% | +12.3% | -6.4% | +3.1% |
Semi-Detached | -3.2% | +8.4% | -4.6% | +6.8% |
Townhouse | -0.4% | +5.8% | +6.8% | -5.3% |
Condominium | +14.3% | +14.3% | +11.4% | +12.2% |
Footnote: Source of statistical data is from the May 2026 and June 2026 Market Watch report of the Toronto Region Real Estate Board (TRREB) MLS.
A – Monthly Percentage Change in the Number of Units Sold

B – Month Over Month Average Price Percentage Change

C – Seasonally Adjusted Month Over Month Average Price Percentage Change

D – Monthly Percentage Change in Average Sale Price


Comments