October 2024 Stats - Market Update
- Nov 11, 2024
- 4 min read
Updated: Dec 1, 2025

What Trends are we Seeing?
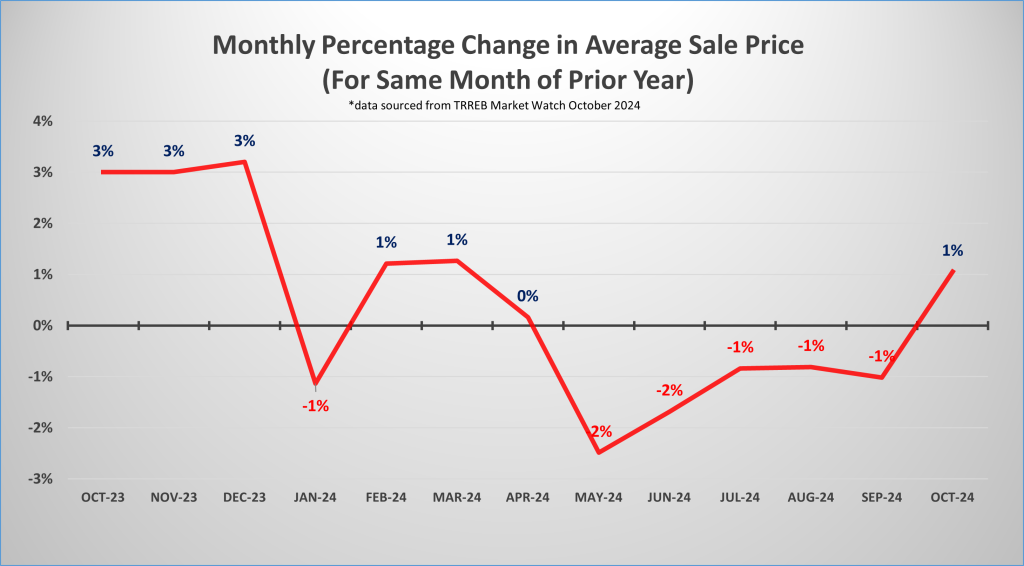
With the Toronto Regional Real Estate Board (TRREB) posting an October 44.4 per cent increase in sales year-over-year it has been noted to be an emphatic movement of buyer’s off of the sidelines and back into the real estate market. Average price increased 1.1 per cent year-over-year in October 2024. The movement in number of sales was entrenched throughout the real estate market both with respect to geographic location and product type.
YEAR-OVER-YEAR TORONTO AND GREATER TORONTO AREA BREAKDOWN | ||||
Product Type | 416 | 905 | ||
Sales | Average Price | Sales | Average Price | |
Detached | 44.2% increase | 4.4% increase | 47.4% increase | 0.1% decrease |
Semi-Detached | 36.3% increase | 3.3% increase | 50.4% increase | 0.4% decrease |
Townhouse | 40.0% increase | 1.3% increase | 61.7% increase | 1.4% decrease |
Condominium | 32.2% increase | 1.0% decrease | 35.9% increase | 4.3% decrease |
The above table illustrates that from an average price perspective, although relatively stable, it is hard not to notice that all product segments in the 905 had some amount year-over-year increase. With the increase in Buyer interest, it does appear that we are at the inflection point where shortly both number of sales and average price may be increasing across the board. It seems that the rise in inventory and aggregate of 125 basis-point cuts to interest rates in the past months from the Bank of Canada has done the trick to move buyer’s off of the sidelines.
What Lies Ahead?
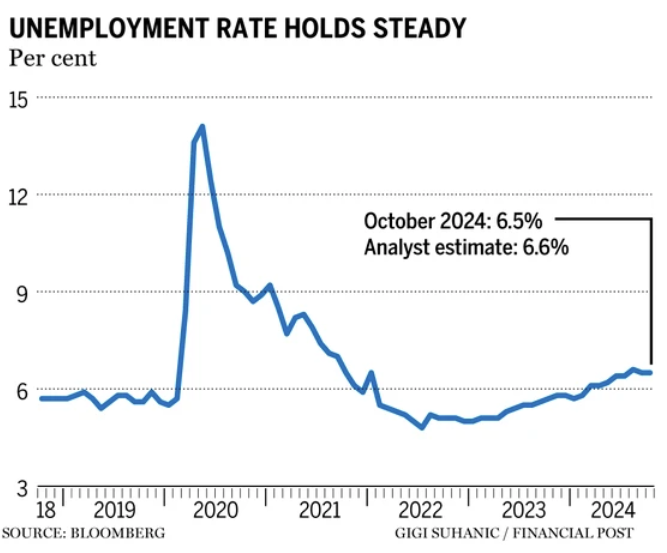
Unemployment, tariffs and interest rates – oh my! The unemployment figures held steady at 6.5 per cent for October beating analysis expectations of 6.6 per cent. Notable however is that the participation rate of 64.8 per cent is the lowest since 1997 (excluding the pandemic) which if it had remained at the prior months figure would have seen unemployment rise to 6.6 per cent. Many expect that as conditions adjust over the next several months, we will see unemployment reach 7.0 per cent.
With potential tariffs being implemented in 2025 the impact with our largest trading partner (U.S.) will spread to the loonie and interest rate decisions both north and south of the boarder. Inflationary pressure in the U.S. may result in the Fed i) slowing down rate cuts and ii) having a higher target for its neutral interest rate. With the value of the Canadian dollar being reduced relative to that of the U.S. dollar and a weaker Gross Domestic Product on the Canadian side of the boarder it will make for more complicated Bank of Canada interest rate decisions. Traders are currently pricing in a 50 per cent chance of a 50 basis-point interest rate adjustment on December 11th 2024 from the bank of Canada and then an aggregate of FIVE 25 basis points downward adjustments by the end of 2025.
From a buyer perspective we continue to encourage a focus on finding the right property to purchase or invest in over the near-term. With legislation changes pending December 15th, 2024, that will allow for expanded 30-year amortizations and push the insured mortgages threshold from $1.0 million to $1.5 million, competition will be picking-up and could become fierce eroding affordability further.
From a seller perspective we expect a version of Christmas coming early to unfold with increased activity earlier than usual where the Spring 2025 real estate market will likely heat up before the snow has left the ground; potentially as early as end of January 2025.
What is Happening with Sale Prices
Sale Price Comparison | ||||
Product Type | Changes from October 2023 to October 2024 | Changes from September 2024 to October 2024 | ||
Toronto | Toronto | GTA | Toronto | GTA |
Detached | +4.4% | -0.1% | +5.5% | +1.1% |
Semi-Detached | +3.3% | -0.4% | +1.2% | +0.3% |
Townhouse | +1.3% | -1.4% | +5.9% | +0.6% |
Condominium | -1.0% | -4.3% | +1.9 | +0.6 |
Number of Transactions Trend
When comparing October 2024 to October 2023, we saw the following trend:
Categories | October 2024 | October 2023 | Percentage Change |
Number of Transactions | 6,658 | 4,611 | +8.5% |
Number of New Listings | 15,328 | 19,536 | +10.5 |
Number of Active Listings | 24,481 | 19,536 | +35.5% |
When comparing October 2024 to September 2024, we saw the following trend:
Categories | October 2024 | September 2024 | Percentage Change |
Number of Transactions | 6,658 | 4,996 | +33.3 |
Number of New Listings | 15,328 | 18,089 | -15.3% |
Number of Active Listings | 24,481 | 25,612 | -4.4% |
Looking into the different geographic pockets of Toronto and the GTA we notice the following changes in number of transactions when comparing October 2024 year-over-year to October 2023 and month-over-month to September 2024. The breakdown per area and product type are as follows:
Number of Transactions Comparison | ||||
Product Type | Changes from October 2023 to October 2024 | Changes from September 2024 to October 2024 | ||
Toronto | GTA | Toronto | GTA | |
Detached | +44.2% | +47.5% | +39.9 | +31.1% |
Semi-Detached | +36.3 | +50.4% | +46.1% | +31.2% |
Townhouse | +40.0% | +61.7% | +41.8% | +31.8% |
Condominium | +32.2% | +35.9% | +34.5% | +25.0% |
Footnote: Source of statistical data is from the September 2024 and October 20204 Market Watch report of the Toronto Region Real Estate Board (TRREB) MLS.
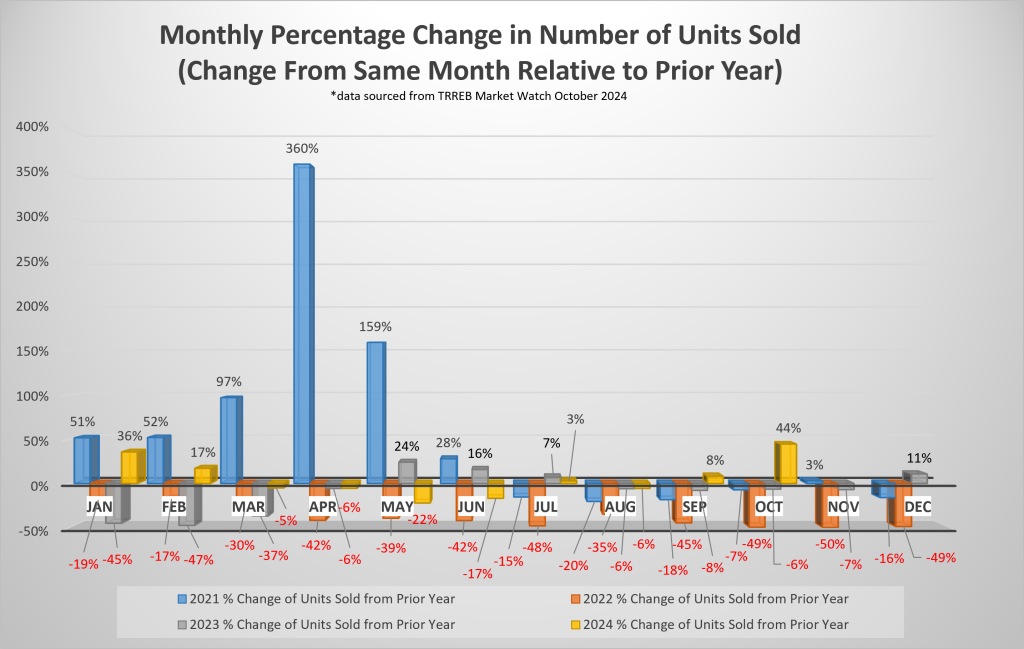
A – Monthly Percentage Change in the Number of Units Sold
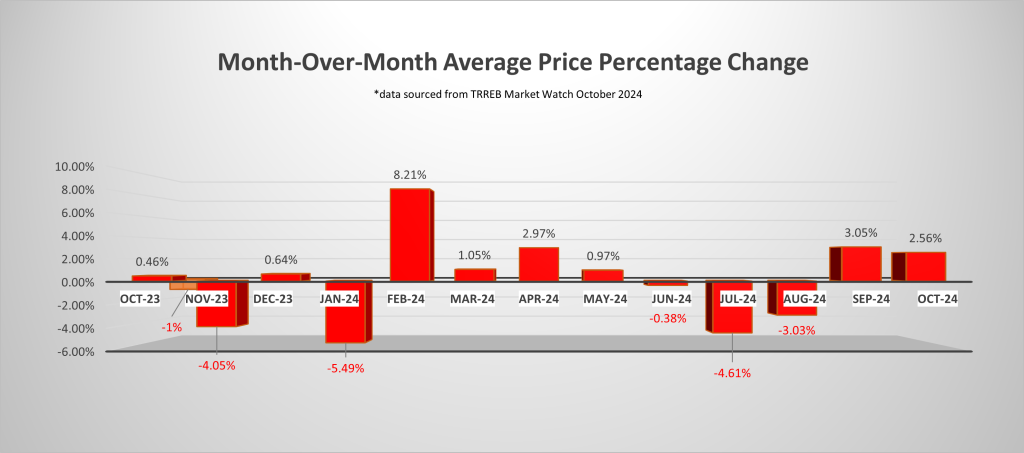
B – Month Over Month Average Price Percentage Change
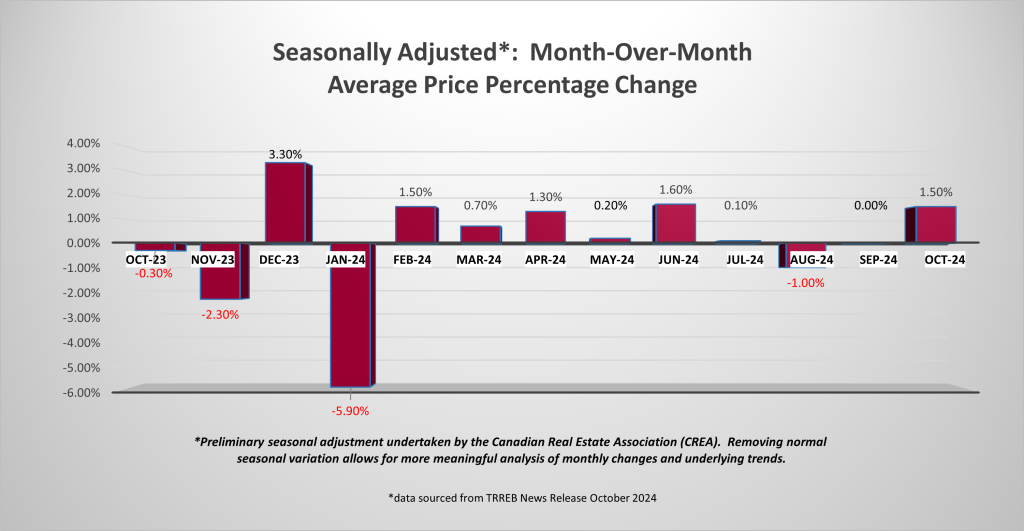
C – Seasonally Adjusted Month Over Month Average Price Percentage Change
D – Monthly Percentage Change in Average Sale Price


Comments