July 2025 - Market Stats
- marketing37571
- Aug 11, 2025
- 4 min read
Updated: Dec 1, 2025

What Trends are we Seeing?
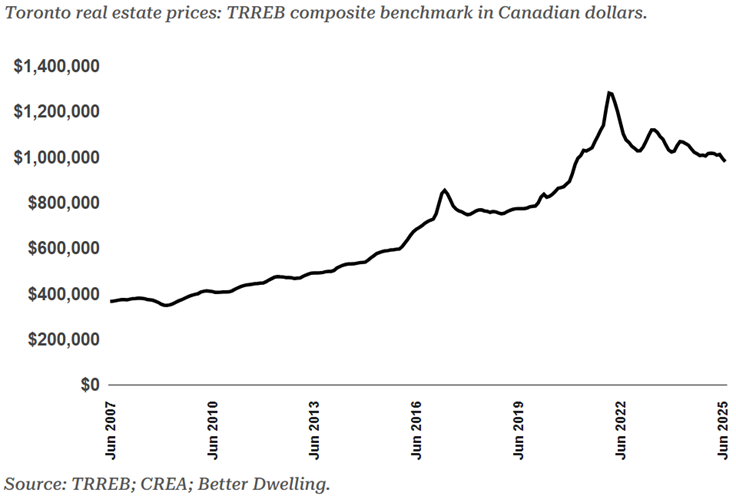
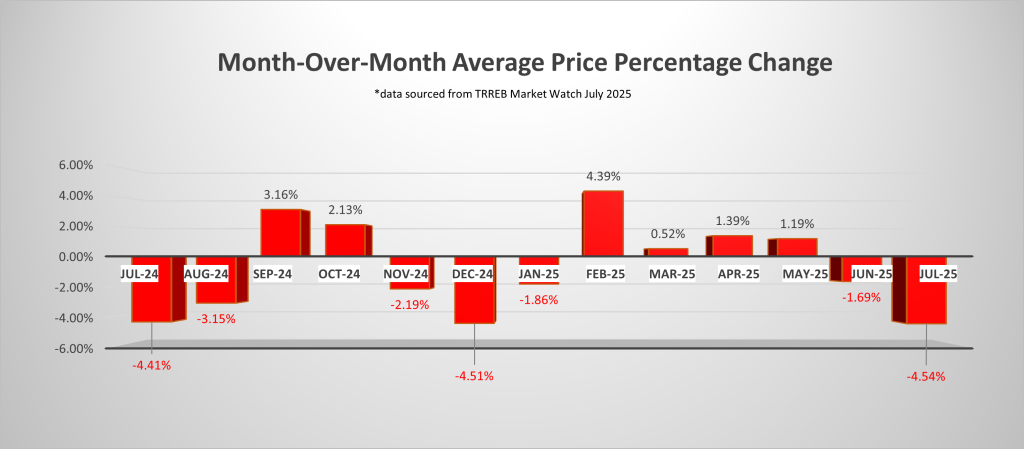
The affordability metric shift showed up in July 2025. February 2022 was the Toronto Regional Real Estate Boards (TRREBs) peak benchmark price. Since then, prices have dropped 23.6 per cent. July 2025 alone represented 4.7 per cent of the total decline in the benchmark price.
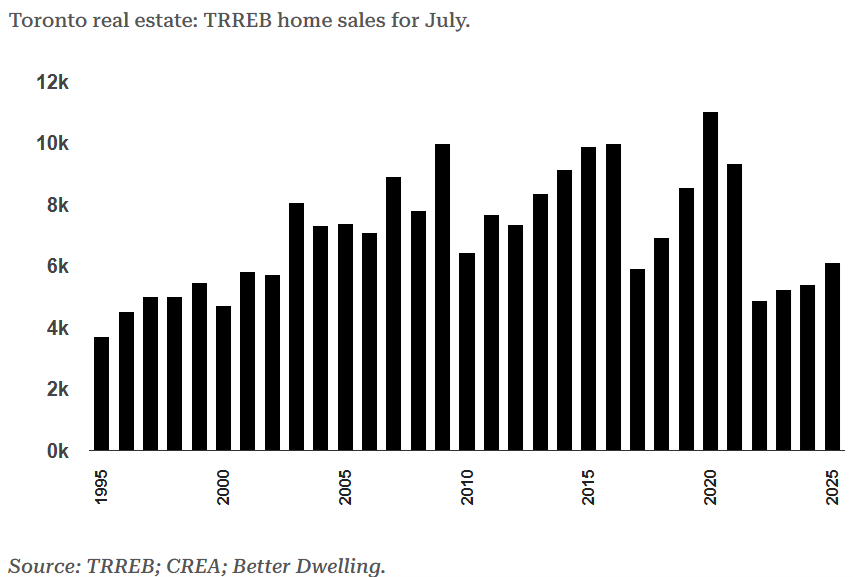
Buyers showed up creating a four year high in terms of number of sales for the month of July. The number of homes sold in Toronto increased by 13 per cent from June 2025 to July 2025. This increase in number of sales represented a 10.9 per cent increase on a year-over-year basis for the month. While the number of homes sold creates an optimistic headline of a real estate market turnaround, it is important to understand that the July 2025 four year high in terms of number of transactions is still 21 per cent below the 10-year average for July.
The Days on Market (DOM) is sitting at 40 with a Sales to New Listing Ratio of 35 per cent putting the market in a clear Buyers market from a technical perspective. You can dig deeper into the numbers below to see area and product segment details relative to number of sales and price impacts.
What we are seeing is that there has bee increased showings and buyer propensity to enter to the market and try their hand with an offer. Sellers seem to be at the stage where they are holding onto the value relatively well in some cases with nominal acknowledgments for the buyers’ market and in others, those under duress or having the desire to simply move on to the next steps in their life from a real estate perspective are serving up opportunities to be captured.
July 2025 seems to be the month where the real estate market finally “blinked”. Buyers found enough stability to move forward and advance their real estate objectives and sellers decided that this was the time that if they were going to sell within the next 12 to 24 months their outcome of selling today would be similar to holding out for greener pastures.
What Lies Ahead?
The Canadian economy has shown resilience in the face of the U.S. trade war. Lack of a decisive go forward plan has sent the Bank of Canada to the sidelines. Gross Domestic Product (GDP) beat analyst expectations avoiding a Q2 2025 negative figure which was initially thought to be the start of a potential technical recession. BoC’s core inflation figures have held stubbornly at the three per cent mark contributing to the handcuffs keeping it from providing market stimulus by way of a rate reduction.
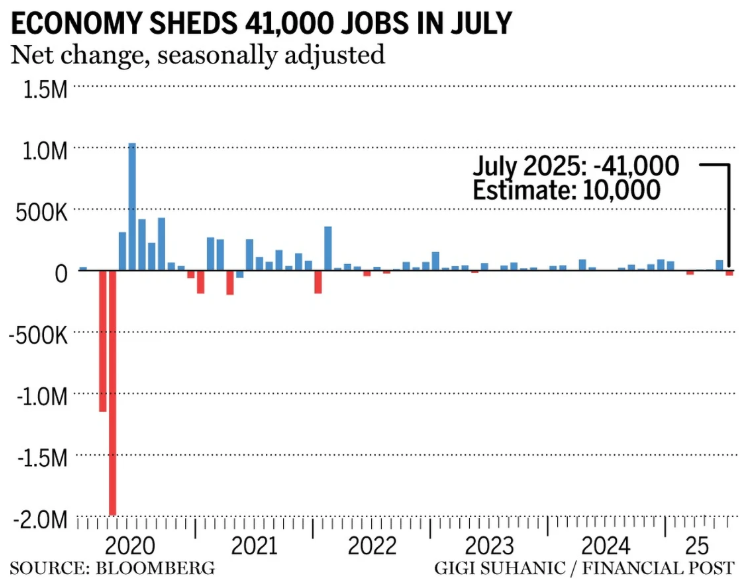
The recent unemployment figures are starting to paint a picture of concern though.
The economy saw a decrease of 41,000 jobs in July with the unemployment rate holding steady (6.9 per cent). Of concern was that there were 51,000 full time job losses and they weren’t driven by trade war focused sectors. The unemployment rate held as the labour force shrank by 33,000 people, the population grew by 37,600 people while the participation rate dropped to 65.2 per cent. The participation rate decline is likely a function of the time it is taking for people to find jobs. The number of long-term unemployed workers reached a rate of 23.8 per cent in July (highest rate since February 1998).
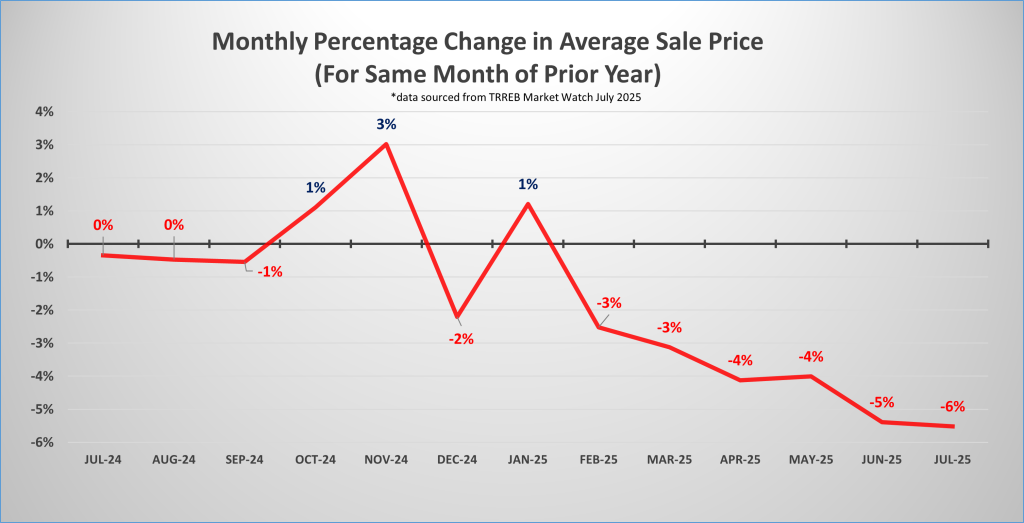
Included in the job losses were the construction industry plus building and support services. Additional interest rate adjustments will support increased affordability; however, their greater impact will be a signal to consumers that we have a direction. Many consumers hold on making large financial decisions, housing amongst the largest, without certainty in the economy or their specific employment sector. For buyers, the double-edged sword of purchasing today never felt sharper. Opportunity has arisen: Sellers are cooperating with some even capitulating. If you bought in July, the benchmark price was 5.4 per cent lower than last year. If you bought in June with a minimum down payment, you saw one-fifth of it wiped out by the end of July. Think long-term in your decision-making process. If you are buying the family home, is it sustainable? Will it hold you as the family grows? Can you stretch now and avoid a move later? If you are investing, look hard, offer often, and opportunity will present itself. For sellers, hyper analysis has never been more important. Our book of business has seen sales in a quarter of the time the market is moving with prices notably above nearby market sales. We have also seen properties that are seemingly well positioned to sell, receive little to no attention from the market. Don’t fall into the trap of making noise that will fall on deaf ears! In many instances, your real estate goals can be accomplished, with the right approach and timing. What is Happening with Sale Prices
Sale Price Comparison | ||||
Product Type | Changes from July 2024 to July 2025 | Changes from June 2025 to July 2025 | ||
Toronto | GTA | Toronto | GTA | |
Detached | -4.6% | -5.4% | -4.2% | -0.6% |
Semi-Detached | -1.1% | -6.8% | -2.8% | -3.4% |
Townhouse | -5.2% | -8.1% | -3.9% | -2.0% |
Condominium | -8.6% | -10.3% | -6.4% | -6.7% |
Number of Transactions Trend
When comparing July 2025 to July 2024, we saw the following trend:
Categories | July 2025 | July 2024 | Percentage Change |
Number of Transactions | 6,100 | 6,397 | +10.9 |
Number of New Listings | 17,613 | 18,413 | +5.7% |
Number of Active Listings | 30,215 | 24,169 | +26.2% |
When comparing July 2025 to June 2025, we saw the following trend:
Categories | July 2025 | June 2025 | Percentage Change |
Number of Transactions | 6,100 | 6,243 | -2.3% |
Number of New Listings | 17,613 | 19,839 | -11.2% |
Number of Active Listings | 30,215 | 31,603 | -4.4% |
Looking into the different geographic pockets of Toronto and the GTA we notice the following changes in number of transactions when comparing July 2025 year-over-year to July 2024 and month-over-month to June 2025. The breakdown per area and product type are as follows:
Number of Transactions Comparison | ||||
Product Type | Changes from July 2024 to July 2025 | Changes from June 2025 to July 2025 | ||
Toronto | GTA | Toronto | GTA | |
Detached | +12.5% | +10.9 | -15.0% | -4.4% |
Semi-Detached | +48.2% | +12.8% | -10.0% | +7.2% |
Townhouse | +12.7% | +6.7% | -3.8% | +1.0% |
Condominium | +3.4% | +10.7 | +3.8% | +5.4% |
Footnote: Source of statistical data is from the June 2025 and July 2025 Market Watch report of the Toronto Region Real Estate Board (TRREB) MLS.
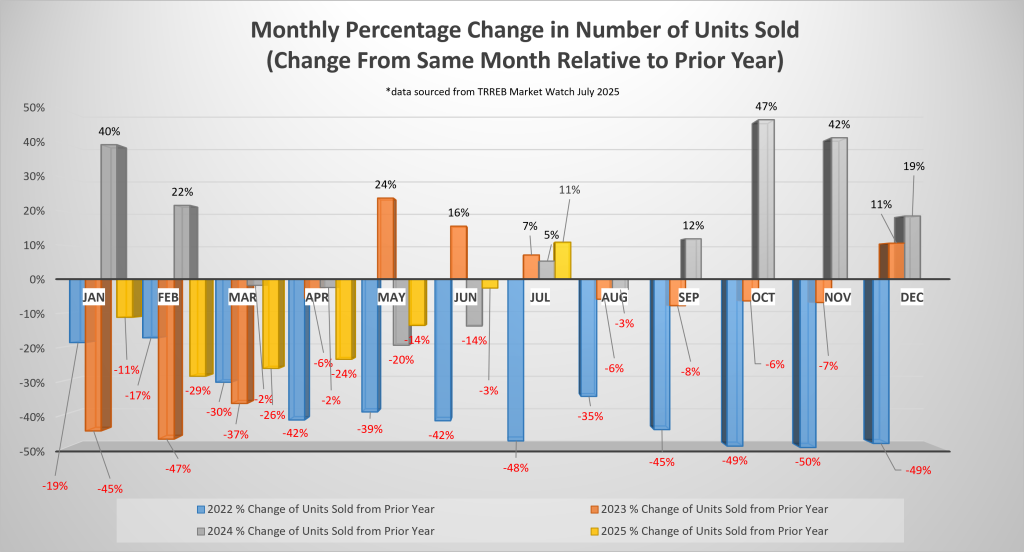
A – Monthly Percentage Change in the Number of Units Sold
B – Month Over Month Average Price Percentage Change
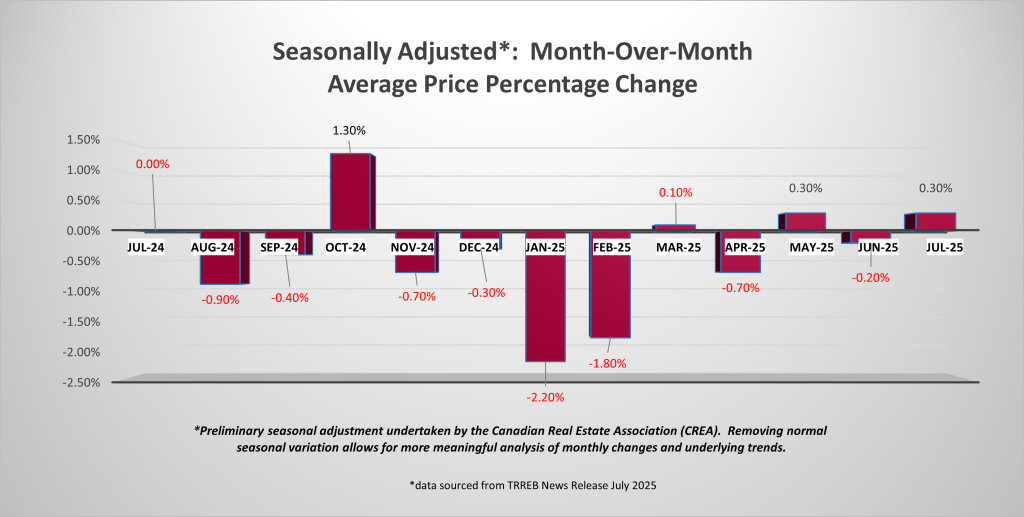
C – Seasonally Adjusted Month Over Month Average Price Percentage Change
D – Monthly Percentage Change in Average Sale Price


Comments