June 2025 - Market Stats
- Jul 7, 2025
- 4 min read
Updated: Dec 1, 2025

What Trends are we Seeing?
By all accounts we should have seen a more significant shift in the affordability metric to the Toronto and Greater Toronto Area (GTA) real estate market. Headlines like
Active listings up 30.8 per cent in June year-over-year
Grater Toronto real estate inventory of active listings of homes for sale on MLS hits a record high for June
Greater Toronto real estate sales slip to a 25-year low
354 new homes sold in May 2025
17 months of new home inventory on hand
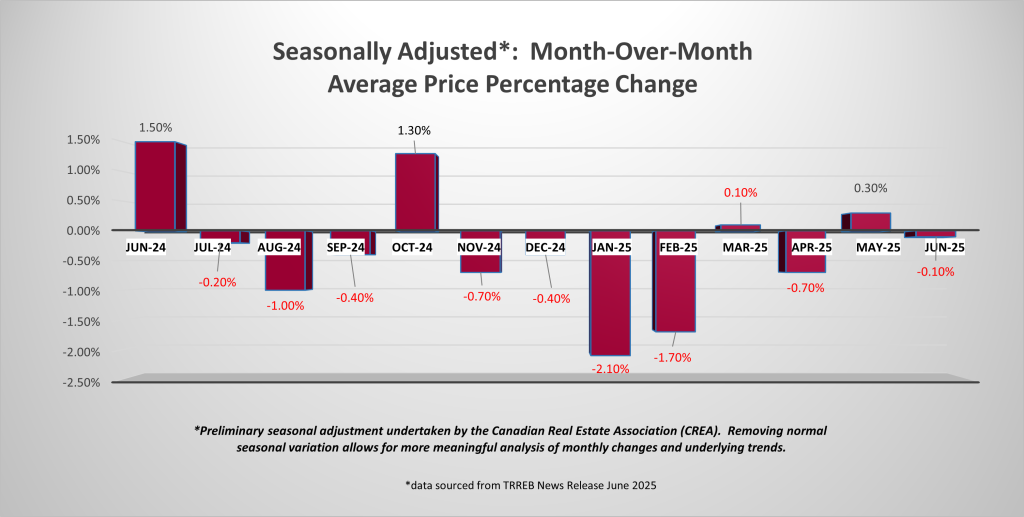
paint a grim picture of the current real estate market. However, when we consider that the number of sales from May 2025 to June 2025 increased 8.1% and that the average selling price (seasonally adjusted) decreased only 0.1 per cent from May 2025 to June 2025 it doesn’t sound like the buyer extravaganza a 31 per cent Sales to New Listings (SNLR) ratio indicating a deep buyer’s market would deliver.
The staring contest continues. Sellers, for the most part, either holding onto their price expectations or not selling and buyers either making the purchase feeling the bottom is near or waiting on the sidelines.
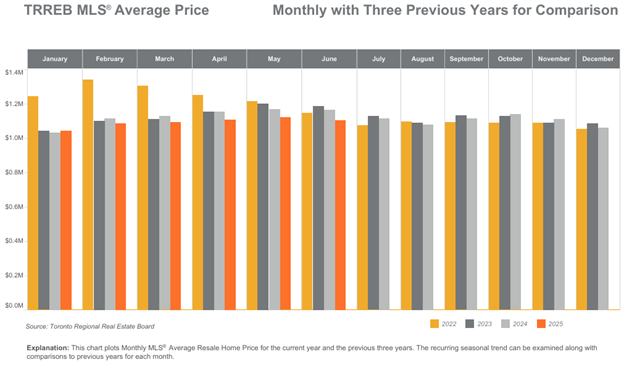
When looking at a four-year capture of average price monthly we see relatively little movement in price post April 2022.
Activity as we see it is best described as sporadic. Notable showing declines on new listings are occurring that go beyond seasonally slower summer months while sales of certain properties are occurring with relatively quick turnover and no consistency in terms of product segmentation, geographic location or type of residence (turnkey versus opportunity to add value). The market seemed to have been on its tipping point Q4 2024 alluding to a shorter recovery versus long and has now seemed to simply plateau waiting for a spark to move it forward. What Lies Ahead?
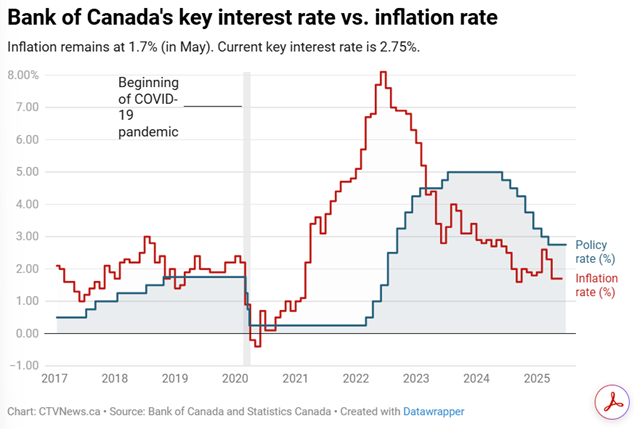
The hyper focus at the outset of the year continued to be on interest rates. Examining unemployment, inflation and gross domestic product (GDP) we postulated as a society what Bank of Canada would do next and how its move would impact the real estate market. We continue to see a variety of mix singles in each of those economic indicators.
Inflation recently posted a comfortable 1.7 per cent headline figure. However, driving the current inflation narrative is that the BoC’s preferred core inflation measure is sticky at a three per cent figure for the last two announcements and most recently 47 per cent of the core basket of goods is above three per cent inflation (increased from a 42 per cent prior reading).
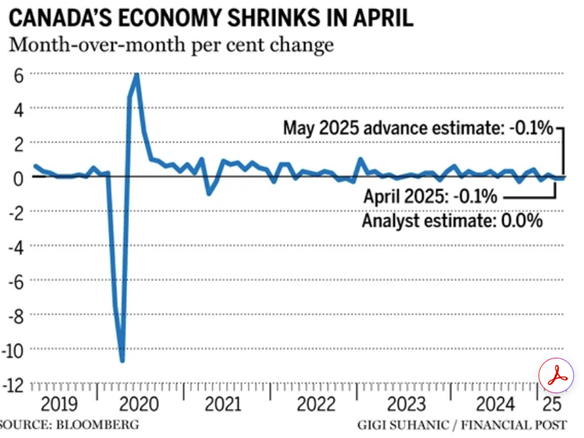
GDP indicators for April show a shrinking economy with a 0.1 per cent drop driven by manufacturing sector declines. The expectation of a Q2 negative GDP seems to be coming to fruition. Q3 GDP is a flip of a coin which if negative would create a technical recession. Within the GDP figures there is concern that it is being propped up by public administration expansion at the provincial and municipal level.
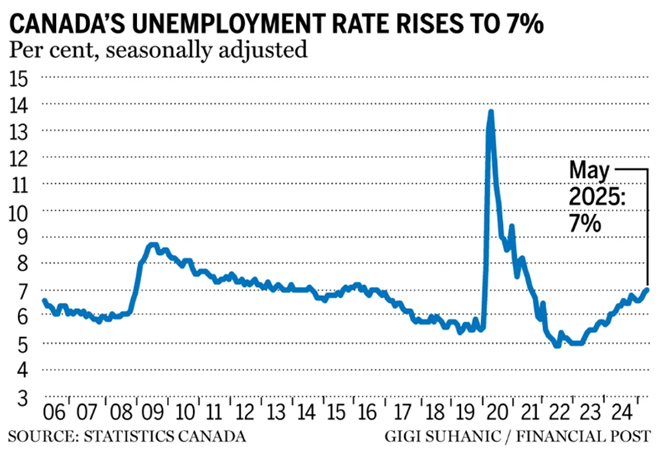
The last unemployment figures are from June 6th, sitting at seven per cent which is the highest since 2016 outside of the pandemic.
What’s becoming clear as the year continues is that interest rates are not going to be the spark to the Toronto and GTA real estate markets. Expectations are that Canadians will get an additional two ¼ basis point rate reductions prior to the end of the year; these will serve as fuel to a recovering real estate market at best. Security is what real estate market participants are looking for. It has become clear that the psychological comfort of a trade agreement with the United States is the biggest piece of the security puzzle. With Canada and the United States targeting a self-imposed July 21st target for a trade agreement, it seems everyone is holding their breath.
For buyers, as we sit in a market defined by several metrics as a buyer’s market it is not too far down the road that sirens are sounding relative to expected housing shortages. Understanding affordability challenges exist today, take stalk of what can be done to accomplish goals today as hitting them in the future may be more challenging.
For sellers, we continue to advise that timeline is the major guiding factor in your decision-making process to sell paired with “what next?”. When we understand your motivation, we can provide guidance as to the steps that should be taken to accomplish your real estate goals.
What is Happening with Sale Prices
Sale Price Comparison | ||||
Product Type | Changes from June 2024 to June 2025 | Changes from May 2025 to June 2025 | ||
Toronto | GTA | Toronto | GTA | |
Detached | -6.5% | -6.5% | -4.5% | -1.4% |
Semi-Detached | -0.4% | -6.0% | -1.6% | -1.0% |
Townhouse | -5.3% | -6.9% | -5.2% | -2.6% |
Condominium | -4.3% | -4.9% | +3.0% | -0.4% |
Number of Transactions Trend
When comparing June 2025 to June 2024, we saw the following trend:
Categories | June 2025 | June 2024 | Percentage Change |
Number of Transactions | 6,243 | 6,397 | -2.4% |
Number of New Listings | 19,839 | 18,413 | +7.7% |
Number of Active Listings | 31,603 | 24,169 | +30.8% |
When comparing June 2025 to May 2025, we saw the following trend:
Categories | June 2025 | May 2025 | Percentage Change |
Number of Transactions | 6,243 | 6,244 | 0.0% |
Number of New Listings | 19,839 | 21,819 | -9.1% |
Number of Active Listings | 31,603 | 30,964 | +2.1% |
Looking into the different geographic pockets of Toronto and the GTA we notice the following changes in number of transactions when comparing June 2025 year-over-year to June 2024 and month-over-month to May 2025. The breakdown per area and product type are as follows:
Number of Transactions Comparison | ||||
Product Type | Changes from June 2024 to June 2025 | Changes from May 2025 to June 2025 | ||
GTA | GTA | Toronto | GTA | |
Detached | +5.9% | -5.7% | +1.7% | 0.0% |
Semi-Detached | +18.6% | -13.0% | +1.1% | -5.6% |
Townhouse | +4.8% | -6.4% | -11.1% | +0.9% |
Condominium | -2.6% | -2.3% | +1.7% | +2.2% |
Footnote: Source of statistical data is from the May 2025 and June 2025 Market Watch report of the Toronto Region Real Estate Board (TRREB) MLS.
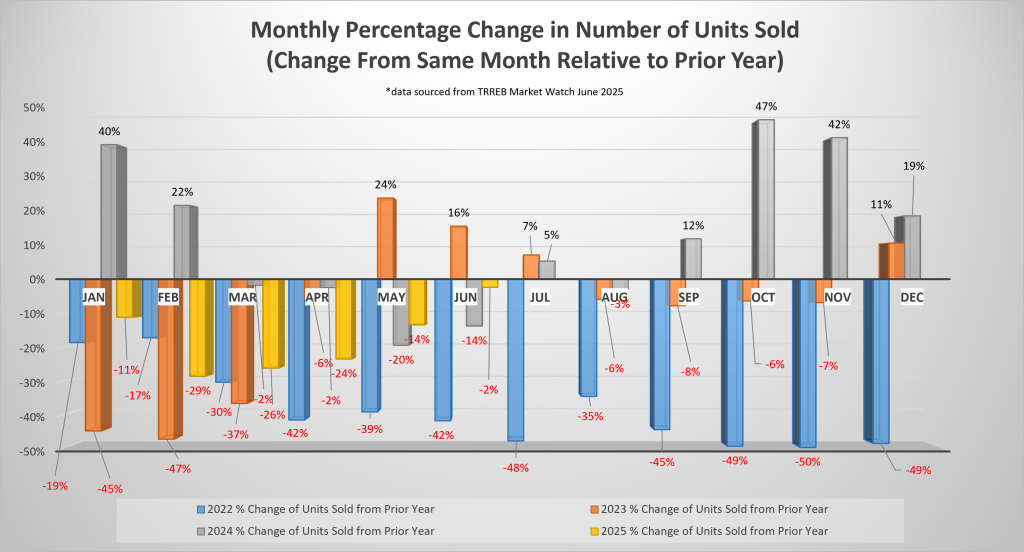
A – Monthly Percentage Change in the Number of Units Sold
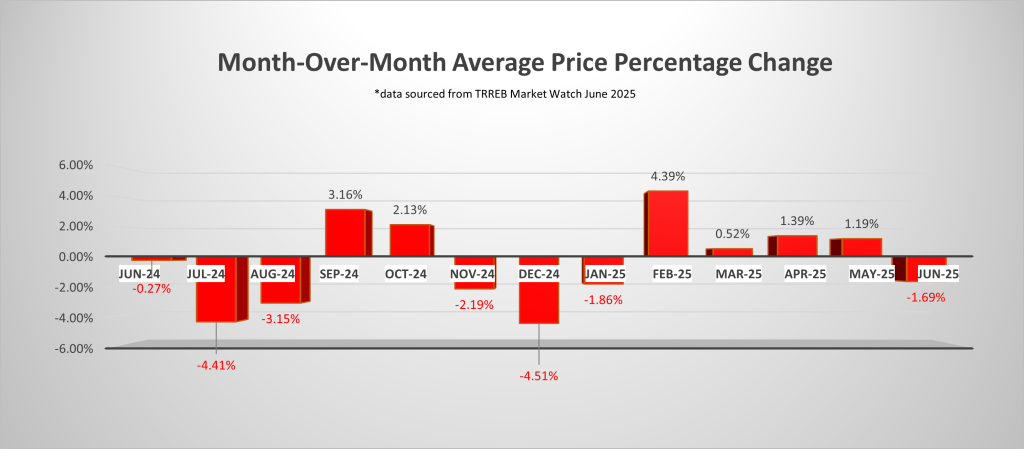
B – Month Over Month Average Price Percentage Change
C – Seasonally Adjusted Month Over Month Average Price Percentage Change
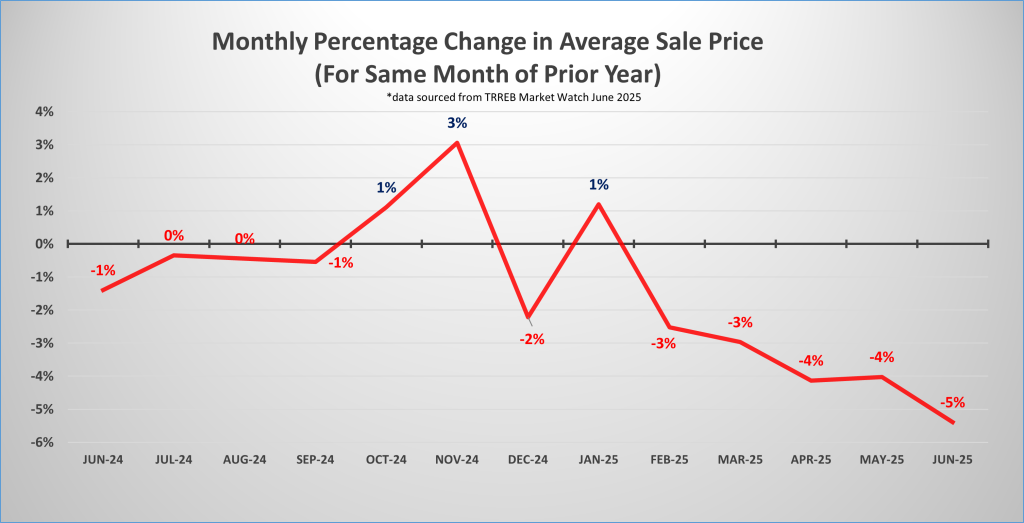
D – Monthly Percentage Change in Average Sale Price


Comments